Water Quality Index
Model Overview
- Water quality refers to the chemical, physical, and biological characteristics of water. It is a crucial aspect of the environment, public health, and various industries that rely on water for different purposes. Water quality is assessed using suitable mathematical/computational models to predict the behaviour of specific water quality parameters in a water body and determine if water is ideal for various uses, such as drinking, agriculture, industrial processes, and supporting aquatic ecosystems.
- Notable water quality parameters include pH, Dissolved Oxygen (DO), Nutrients (nitrogen and phosphorus), Biological Oxygen Demand (BOD), Chemical Oxygen Demand (COD), Heavy metal, Coliform bacteria, Chlorophyll-a concentration (Chl-a), absorption coefficient of Colored Dissolved Organic Matter (aCDOM) and Total Suspended Solids (TSS).
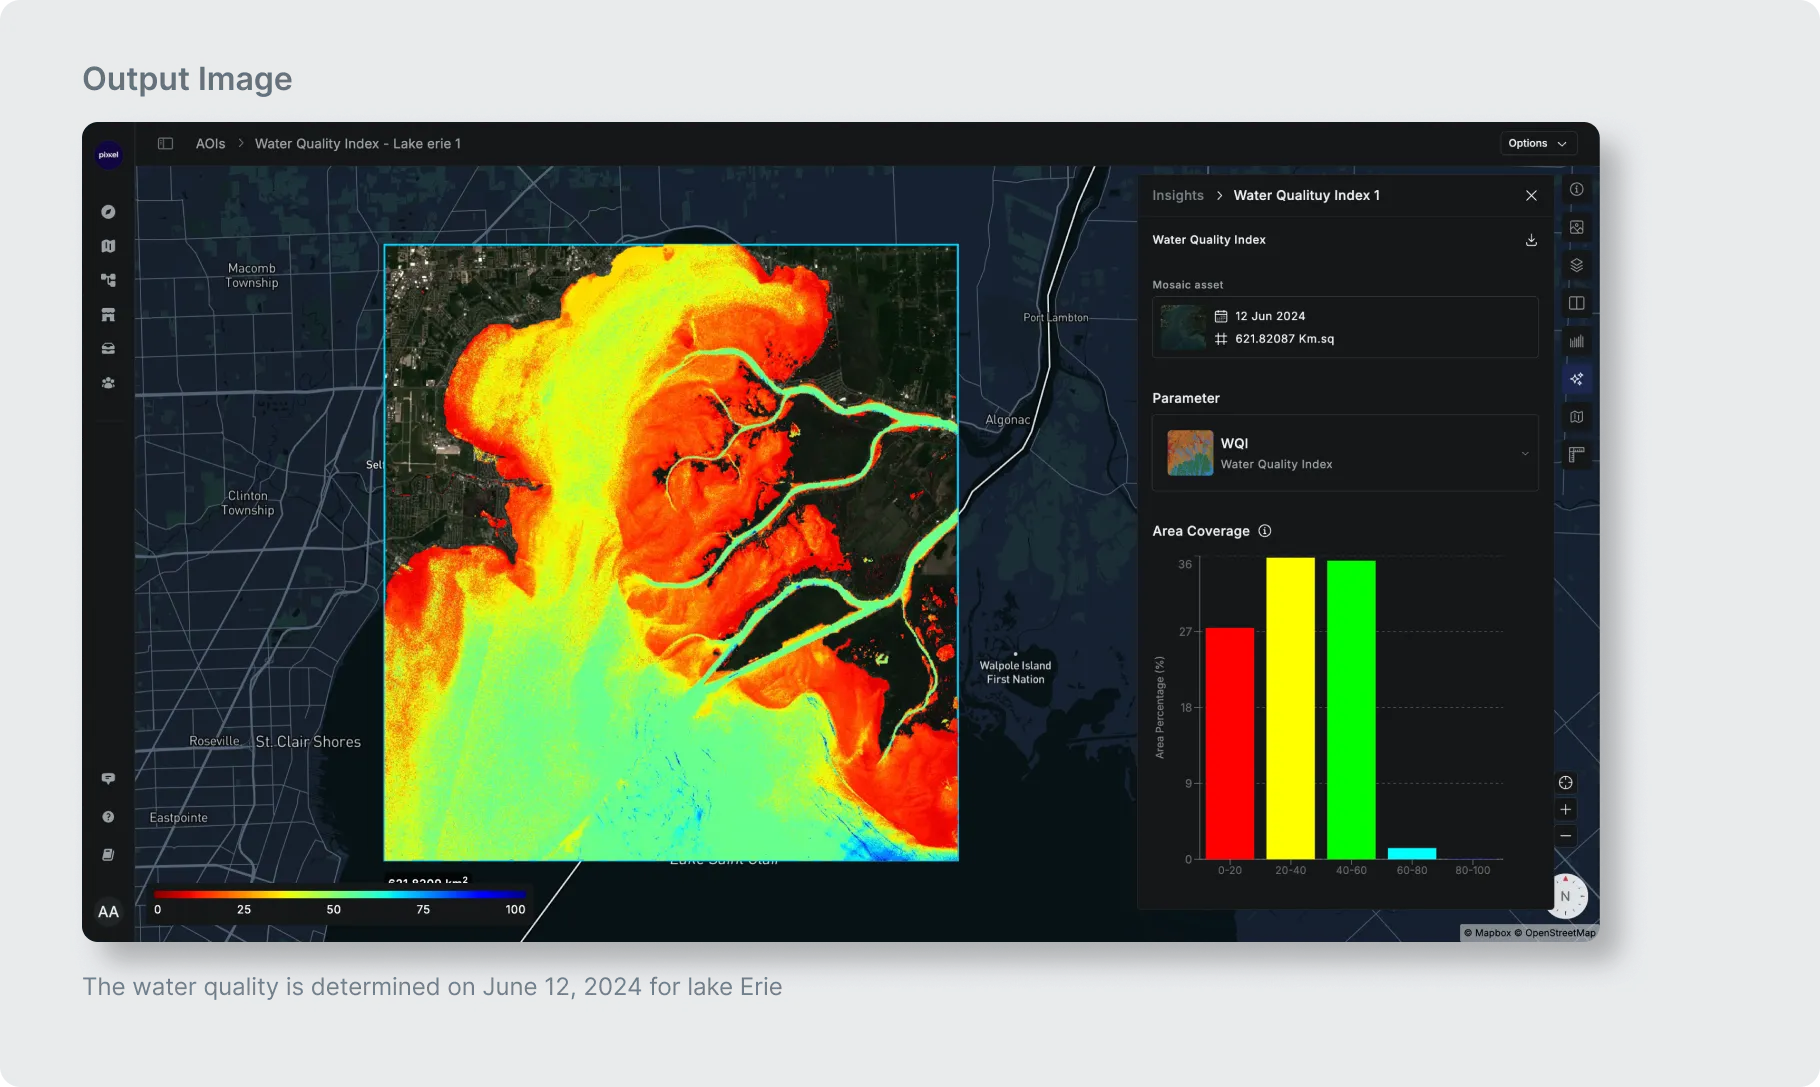
- Only optically active parameters such as Chl-a (in mg m-3), TSS (in g m-3), and aCDOM(440) (in m-1) are considered valid inputs to the present Water Quality Index model and estimated directly from satellite-derived Level-2 water reflectance images after applying suitable bio-optical/machine learning algorithms. These three parameters are then used for the calculation of the Trophic State Index (TSI), TSS Index (TI), and CDOM Index (CI). Later, TSI, TI and CI are supplied to the Fuzzy Inference System (FIS) model as inputs to generate the Water Quality Index (WQI) raster image.
- The calculated TSI, TI, CI, and WQI rasters will have values between 0-100 (Unitless), and the significance of these indexes for analysing water quality can be easily interpreted from table below.
| TSI | Water type (based on TSI range) | TI | Water type (based on TI range) | CI | Water type (based on CI range) | WQI | Water quality (based on WQI) |
|---|---|---|---|---|---|---|---|
| 0–30 | Ultra-Oligotrophic | 0–40 | Low turbid | 0–41 | Low CDOM | 80–100 | Good |
| 30–40 | Oligotrophic | 40–54 | Moderate turbid | 41–47 | Moderate CDOM | 60–80 | Average |
| 40–50 | Mesotrophic | 54–60 | High turbid | 47–77 | High CDOM | 40–60 | Poor |
| 50–60 | Eutrophic | 60–100 | Very high turbid | 77–100 | Very high CDOM | 20–40 | Very Poor |
| 60–100 | Hypertrophic | – | – | – | – | 0–20 | Extremely Poor |
Input and Output
- Input
| Parameters | Descriptions |
|---|---|
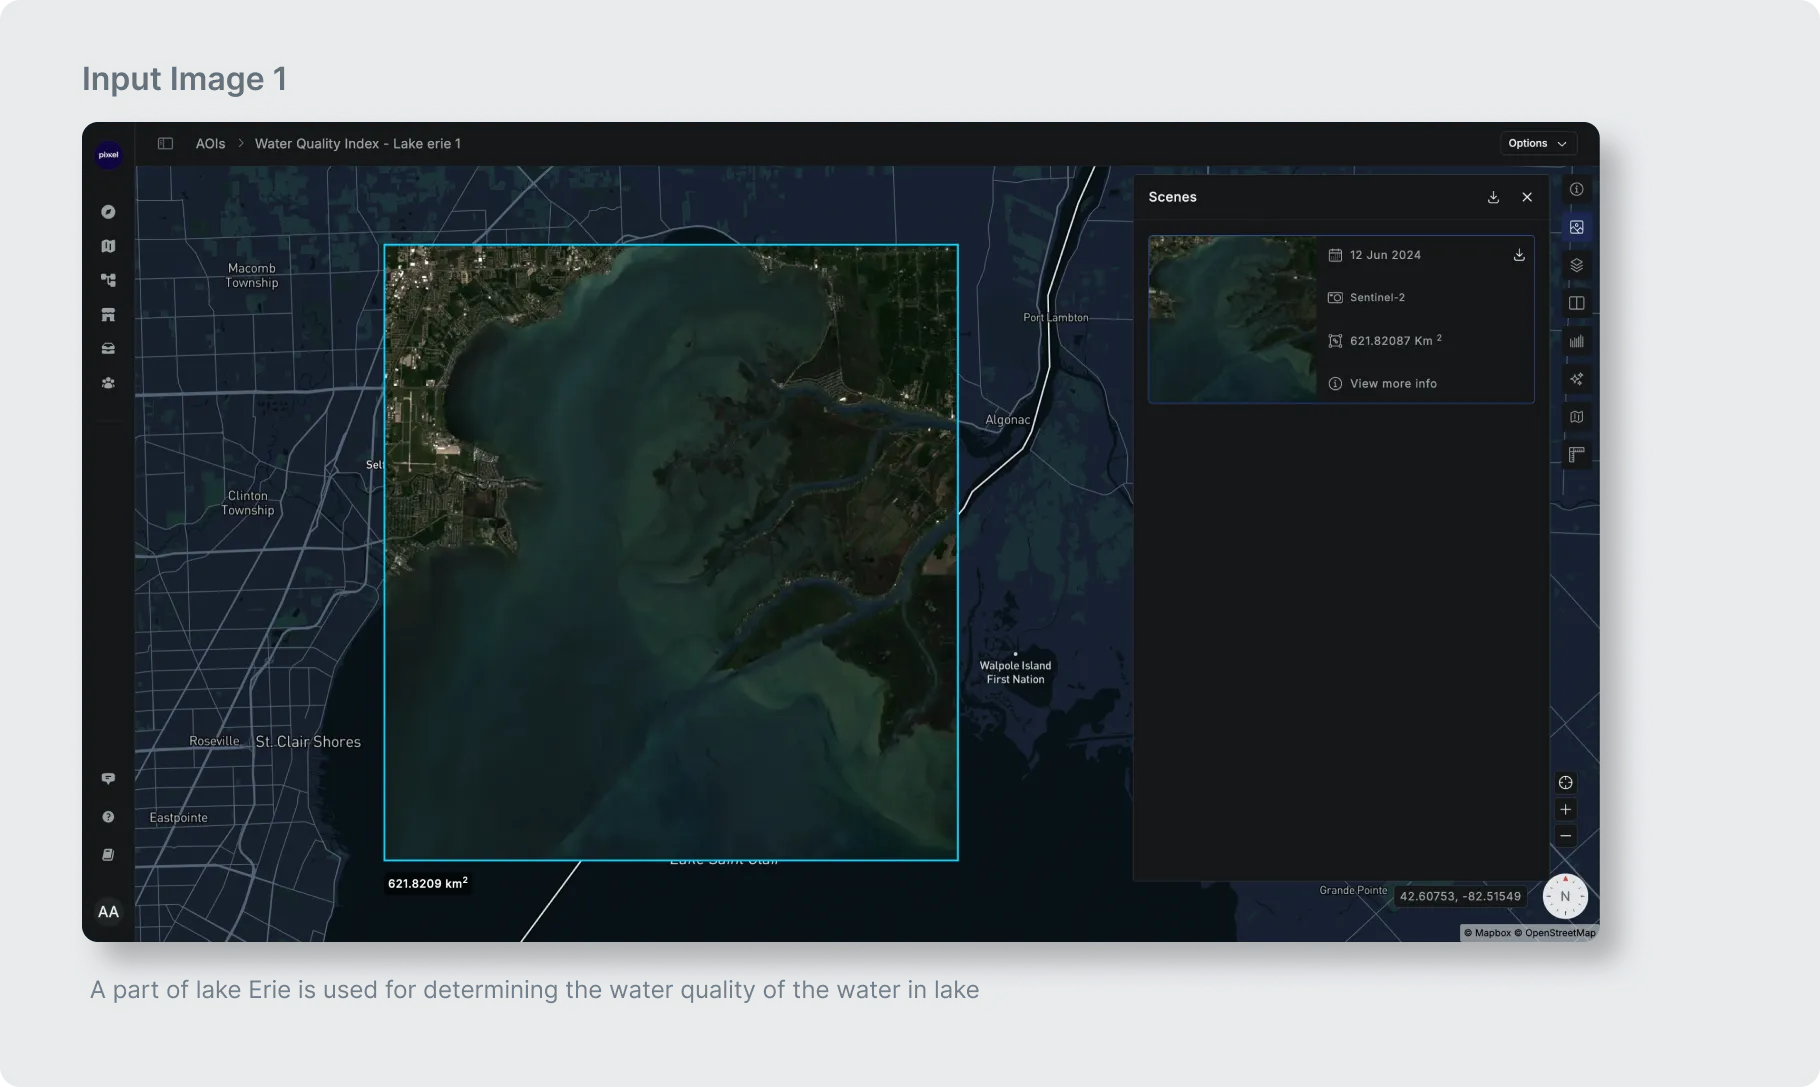
| Area of Interest | Area for which you want to perform water quality analysis |
- Output
The model generates seven single-band raster files, visualized over the Area of Interest (AOI), highlighting all water areas with corresponding values and colors based on a predefined color scale. Non-aquatic areas will be transparent, revealing the base image.
| Output and parameters | Description | Type | Downloadable as |
|---|---|---|---|
| Chl-a (Chlorophyll-a) | Measures the amount of chlorophyll-a pigment in water, indicating algal growth and biomass. High levels can signal excessive algae and potential water quality issues. | Single band raster file | GeoTiff File format |
| aCDOM(440) (Absorption coefficient of CDOM) | Measures the absorption coefficient of Colored Dissolved Organic Matter at 440nm, indicating organic pollution from sources like agricultural or urban runoff and wastewater discharge. High levels reduce water transparency and affect ecosystems. | Single band raster file | GeoTiff File format |
| TSS (Total Suspended Solids) | Indicates concentration of suspended particles. High TSS can result from soil erosion, sediment runoff, or pollution, impacting water clarity and aquatic life. | Single band raster file | GeoTiff File format |
| TSI (Trophic State Index) | A normalized version of Chl-a indicating the trophic status. | Single band raster file | GeoTiff File format |
| CI (CDOM Index) | A normalized version of the absorption coefficient of CDOM at 440nm(aCDOM(440)). | Single band raster file | GeoTiff File format |
| TI (TSS Index) | A normalized version of TSS. | Single band raster file | GeoTiff File format |
| WQI (Water Quality Index) | Assesses the chemical, physical, and biological characteristics of water using mathematical/computational models. | Single band raster file | GeoTiff File format |
| Table | Table shows quantification of area for different ranges of a particular parameter. | Table | CSV file |
| Graphs | Graph is a better visualization for the table created. | Bar Graph | JPEG image |
Expected Model Run Time
| AOI Size Range (in Sq KM) | Estimated Model Run Time |
|---|---|
| 0–500 | 12 minutes |
| 500–2000 | 50 minutes |
| 2000–2500 | 62 minutes |
| 2500–3000 | 75 minutes |
| 3000–3500 | 90 minutes |
| 3500–4000 | 105 minutes |
| 4000–4500 | 118 minutes |
| 4500–5000 | 131 minutes |
Additional Details
Minimum size of Area of Interest required (in Sq KMs.): No such restrictions Maximum size of Area of Interest supported (in Sq KMs.): 5000 Sq KMs Geographies supported: All geographies Sensors Supported: Sentinel-2. (It will support Pixxel FireFly in future)WQI images may not show enough variability if TSI, TI, and CI values stay almost constant, which usually happens when the area of the inland water body is tiny (in order of few Sq KMs) and in open ocean waters.