Pixxel
Documentation
Developer Guide
Pixxel API
Overview
About PixxelPixxel's ConstellationPixxel's Tech Demonstrators

Getting Started
AuroraQuick Start

Tasking
Tasking Basics

Available BandsetsCustom Bandsets
Ordering and Cart
Archive OrderingWorking with CartOrder Listing, Status and Details
Catalog and Delivery
My CatalogExport ImageryNaming Convention
Explore Images & Create AOIs
ExploreSearch Location and Draw/Upload AOISearch and Select ImagesSatellite DataAOI Info and Scenes
Analytics Tools

OverviewPreset Indices & Custom Indices

Bands
Spectral SignatureSplit Compare
Analytical Models
Insights in Aurora (AOI Screen)Model Marketplace

Workflows
Workflow and Jobs
Aurora Intelligence
OverviewImage Search
Legal Documents
Third Party Satellite Provider Documents
  1. Analytics Tools
  2. Visualizations
  3. Overview

Overview

Remote sensing satellites capture a number of layers for a single image. In hyperspectral imaging, layers can represent different spectral bands or wavelengths. Each layer corresponds to a specific range of electromagnetic radiation. For example, one layer could capture data in the visible light spectrum, another in the near-infrared, and so on. These layers help build a comprehensive view of the scene being observed. Researchers can identify specific materials, vegetation health, pollution levels, and more by analyzing the data in different layers.

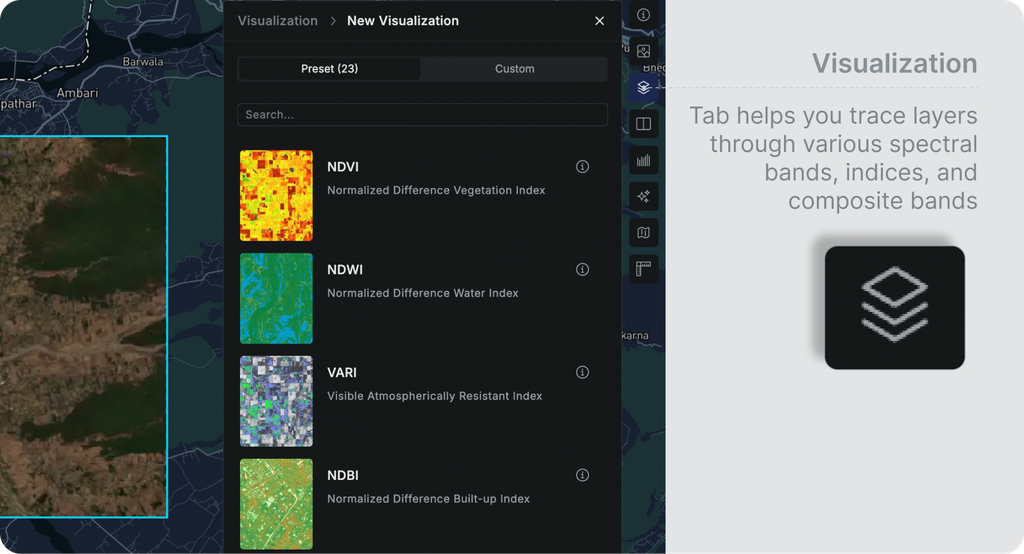
The visualization tab helps you trace these layers through various spectral bands, indices, and composite bands. Learning the meaning behind visualization will help you analyze your AOI better. Following are the various types of visual styles available for an AOI.

  1. Indices
    1. Preset Indices
    2. Custom Indices
  2. Composite bands
  3. Single Bands

AOI Info and ScenesPreset Indices & Custom Indices